
Power BI Course
The Power BI is huge in demand due to its awesome visual tool. In the power bi course we will learn to create, share and publish the reports on live data.
You’ll also learn to handle complex data, write your own queries, handling power Query and various dax functions to make your report unique.
What you'll learn in Power BI Course
Power BI Part
Examine, navigate, and learn to use the various features of Power BI
Assess the quality of the data and perform exploratory analysis
Create and design visualizations and dashboards for your intended audience
Combine the data to and follow the best practices to present your story
SQL Part
Explore the possibilities of SQL Query Language
Perform Multi Level Joins to extract meaningful data from database
Create Subqueries to get data and transform them in a fashionable manner
Create your own rule based trigger / procedure for the organiszed data behaviour
Learning SQL in Power BI Course
SQL (Structured Query Language is a critical tool for data professionals. It is one of the most important tools for data visualization, data analysis or data sciences.
SQL Queries helps professionals to extract meaningful data to perform analysis over raw data.
In this data visualization course, we will cover what is SQL and how does it work. Let’s start learning to understanding various types of queries over Structured Query Language.
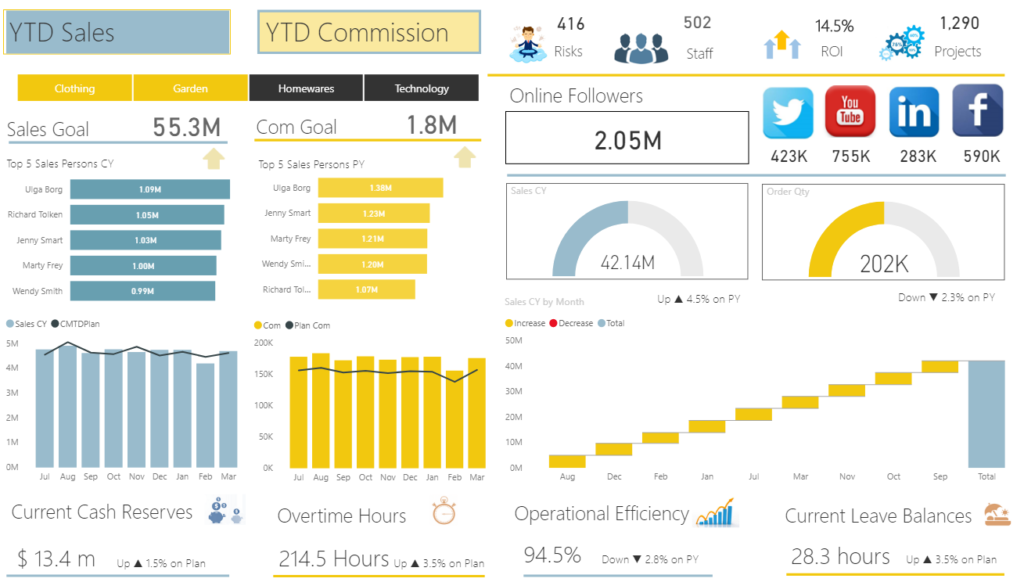
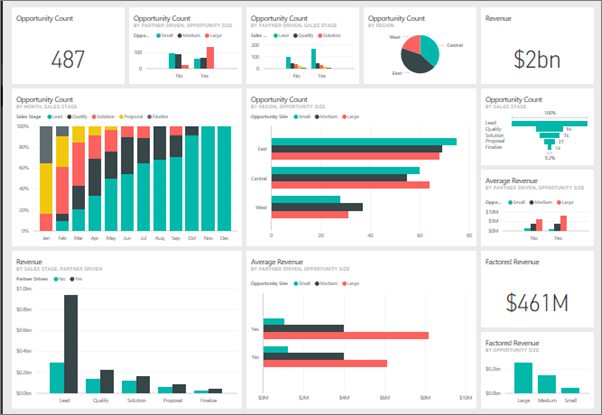
Learning Power BI
Interesting Dashboard Examples
Power BI Course Detail
- Data, Databases and RDBMS Software
- Database Types : OLTP, DWH, OLAP
- Microsoft SQL Server Advantages, Use
- Versions and Editions of SQL Server
- SQL : Purpose, Real-time Usage Options
- SQL Versus Microsoft T-SQL MSSQL
- Microsoft SQL Server – Career Options
- SQL Server Components and Usage
- Database Engine Component and OLTP
- BI Components, Data Science Components
- ETL, MSBI and Power BI Components
- Course Plan, Concepts, Resume, Project
- 24 x 7 Online Lab for Remote DB Access
- Software Installation Pre-Requisites
- Power BI Job Roles in Real-time
- Power BI Data Analyst Job Roles
- Business Analyst – Job Roles
- Power BI Developer – Job Roles
- Power BI for Data Scientists
- Comparing MSBI and Power BI
- Comparing Tableau and Power BI
- MCSA 70-778, MCSA 70-779 Exam
- Types of Reports in Real-World
- Interactive & Paginated Reports
- Analytical & Mobile Reports
- Data Sources Types in Power BI
- Power BI Licensing Plans – Types
- Power BI Training : Lab Plan
- Power BI Dev & Prod Environments
- Understanding the Power BI Tools
- Installing Power BI & Connecting to Data
- The “Locale” used in the curriculum
- Working with the query Editor
- Working with the data model and creating a visualization
- Power BI Desktop Installation
- Data Sources & Visual Types
- Canvas, Visualizations and Fields
- Get Data and Memory Tables
- In-Memory xvelocity Database
- Table and Tree Map Visuals
- Format Button and Data Labels
- Legend, Category and Grid
- PBIX and PBIT File Formats
- Visual Interaction, Data Points
- Disabling Visual Interactions
- Edit Interactions – Format Options
- SPOTLIGHT & FOCUSMODE
- CSV and PDF Exports. Tooltips
- Power BI EcoSystem, Architecture
- Slicer Visual : Real-time Usage
- Orientation, Selection Properties
- Single & Multi Select, CTRL Options
- Slicer : Number, Text and Date Data
- Slicer List and Slicer Dropdowns
- Visual Sync Limitations with Slicer
- Disabling Slicers, Clear Selections
- Grouping : Real-time Use, Examples
- List Grouping and Binning Options
- Grouping Static / Fixed Data Values
- Grouping Dynamic / Changing Data
- Bin Size and Bin Limits (Max, Min)
- Bin Count and Grouping Options
- Grouping Binned Data, Classification
- Creating Hierarchies in Power BI
- Independent Drill-Down Options
- Dependant Drill-Down Options
- Conditional Drilldowns, Data Points
- Drill Up Buttons and Operations
- Expand & Show Next Level Options
- Dynamic Data Drills Limitations
- Show Data and See Records
- Filters : Types and Usage in Real-time
- Visual Filter, Page Filter, Report Filter
- Basic, Advanced and TOP N Filters
- Category and Summary Level Filters
- DrillThru Filters, Drill Thru Reports
- Keep All Filters” Options in DrillThru
- CrossReport Filters, Include, Exclude
- Drill-thru Filters, Page Navigations
- Bookmarks : Real-time Usage
- Bookmarks for Visual Filters
- Bookmarks for Page Navigations
- Selection Pane with Bookmarks
- Buttons, Images with Actions
- Buttons, Actions and Text URLs
- Bookmarks View & Selection Pane
- OLTP Databases, Big Data Sources
- Azure Database Access, Reports
- Import & Direct Query with Power BI
- SQL Queries and Enter Data
- Data Modeling : Currency, Relations
- Summary, Format, Synonyms
- Web View & Mobile View in PBI
- Stacked Charts and Clustered Charts
- Line Charts, Area Charts, Bar Charts
- 100% Stacked Bar & Column Charts
- Map Visuals: Tree, Filled, Bubble
- Cards, Funnel, Table, Matrix
- Scatter Chart : Play Axis, Labels
- Series Clusters & Selections
- Waterfall Chart and ArcGIS Maps
- Infographics, Icons and Labels
- Color Saturation, Sentiment Colors
- Column Series, Column Axis in Lines
- Join Types : Round, Bevel, Miter
- Shapes, Markers, Axis, Plot Area
- Display Units, Data Colors, Shapes
- Series, Custom Series and Legends
- Power Query M Language Purpose
- Power Query Architecture and ETL
- Data Types, Literals and Values
- Power Query Transformation Types
- Table & Column Transformations
- Text & Number Transformations
- Date, Time and Structured Data
- List, Record and Table Structures
- let, source, in statements @ M Lang
- Power Query Functions, Parameters
- Invoke Functions, Execution Results
- Get Data, Table Creations and Edit
- Merge and Append Transformations
- Join Kinds, Advanced Editor, Apply
- ETL Operations with Power Query
- Query Duplicate, Query Reference
- Group By and Advanced Options
- Aggregations with Power Query
- Transpose, Header Row Promotion
- Reverse Rows and Row Count
- Data Type Changes & Detection
- Replace Columns: Text, NonText
- Replace Nulls: Fill Up, Fill Down
- PIVOT, UNPIVOT Transformations
- Move Column and Split Column
- Extract, Format and Numbers
- Date & Time Transformations
- Deriving Year, Quarter, Month, Day
- Add Column : Query Expressions
- Query Step Inserts and Step Edits
- Creating Parameters in Power Query
- Parameter Data Types, Default Lists
- Static/Dynamic Lists For Parameters
- Removing Columns and Duplicates
- Convert Tables to List Queries
- Linking Parameters to Queries
- Testing Parameters and PBI Canvas
- Multi-Valued Parameter Lists
- Creating Lists in Power Query
- Converting Lists to Table Data
- Advanced Edits and Parameters
- Data Type Conversions, Expressions
- Columns From Examples, Indexes
- Conditional Columns, Expressions
- DAX : Importance in Real-time
- Real-world usage of Excel, DAX
- DAX Architecture, Entity Sets
- DAX Data Types, Syntax Rules
- DAX Measures and Calculations
- ROW Context and Filter Context
- DAX Operators, Special Characters
- DAX Functions, Types in Real-time
- Vertipaq Engine, DAX Cheat Sheet
- Creating, Using Measures with DAX
- Creating, Using Columns with DAX
- Quick Measures and Summaries
- Validation Errors, Runtime Errors
- SUM, AVERAGEX, KEEPFILTERS
- Dynamic Expressions, IF in DAX
- Data Modeling Options in DAX
- Detecting Relations for DAX
- Using Calculated Columns in DAX
- Using Aggregated Measures in DAX
- Working with Facts & Measures
- Modeling : Missing Relations
- Modeling : Relation Management
- CALCULATE Function Conditions
- CALCULATE & ALL Member Scope
- RELATED & COUNTROWS in DAX
- Entity Sets and Slicing in DAX
- Dynamic Expressions, RETURN
- Date, Time and Text Functions
- Logical, Mathematical Functions
- Running Total & EARLIER Function
- Connection with CSV, MS Access
- AVERAGEX and AVERAGE in DAX
- KEEPFILTERS and CALCUALTE
- COUNTROWS, RELATED, DIVIDE
- PARALLELPERIOD, DATEDADD
- CALCULATE & PREVIOUSMONTH
- USERELATIONSHIP, DAX Variables
- TOTALYTD , TOTALQTD
- DIVIDE, CALCULATE, Conditions
- IF..ELSE..THEN Statement
- SELECTEDVALUE, FORMAT
- SUM, DATEDIFF Examples in DAX
- TODAY, DATE, DAY with DAX
- Time Intelligence Functions – DAX
- Power BI Service Architecture
- Power BI Cloud Components, Use
- App Workspaces, Report Publish
- Reports & Related Datasets Cloud
- Creating New Reports in Cloud
- Report Publish and Report Uploads
- Dashboards Creation and Usage
- Adding Tiles to Dashboards
- Pining Visuals and Report Pages
- Visual Pin Actions in Dashboards
- LIVE Page Interaction in Dashboard
- Adding Media: Images, Custom Links
- Adding Chs and Embed Links
- API Data Sources, Streaming Data
- Streaming Dataset Tiles (REST API)
- Dashboards Actions, Report Actions
- DataSet Actions: Create Report
- Share, Metrics and Exports
- Mobile View & Dashboard Themes
- Q & A Cortana and Pin Visuals
- Export, Subscribe, Subscribe
- Favorite, Insights, Embed Code
- Featured Dashboards and Refresh
- Gateways Configuration, PBI Service
- Gateway Types, Cloud Connections
- Gateway Clusters, Add Data Sources
- Data Refresh : Manual, Automatic
- PBIEngw Service, ODG Logs, Audits
- DataFlows, Power Query Expressions
- Adding Entities and JSON Files
- Import and Upload Options in Excel
- Excel Workbooks and Dashboards
- Datasets in Excel and Dashboards
- Using Excel Analyzer in Power BI
- Using Excel Publisher in PBI Cloud
- Excel Workbooks, PINS in Power BI
- Excel ODC Connections, Power Pivot
- Row Level Security (RLS) with DAX
- Need for RLS in Power BI Cloud
- Data Modeling in Power BI Desktop
- DAX Roles Creation and Testing
- Adding Power BI Users to Roles
- Custom Visualizations in Cloud
- Histogram, Gantt Chart, Infographics
- Need for Report Server in PROD
- Install, Configure Report Server
- Report Server DB, Temp Database
- Webservice URL, Webportal URL
- Creating Hybrid Cloud with Power BI
- Using Power BI DesktopRS
- Uploading Interactive Reports
- Report Builder For Report Server
- Report Builder For Power BI Cloud
- Designing Paginated Reports (RDL)
- Deploy to Power BI Report Server
- Data Source Connections, Report
- Power BI Report Server to Cloud
- Tenant IDs Generation and Use
- Mobile Report Publisher, Usage
- Overview
- Basic Power App Concept
- Canvas Apps | Navigation | Customisation
- Contents (Galleries, Data Cards, Forms, Triggers, Functions &
- Formulas, Edit Forms, Text Boxes)
- Why Power Bi Service?
- Comparison Power BI Free & Premium
- Logging into Power Bi Service
- Interface overview
- Importing data from Desktop to Service
- Dataset menu
- Working on reports
- Dashboard overview
- Workspace & Gateways
- Installing Gateways – Personal & On-premise
- Working alone or collaborating with colleagues
- Collaborating in App Workspace
- Sharing the results
- Publishing the app
- Content packs from online services
- Power Bi Mobile Overview
- Excluding dataset from sharing
- POWER BI AND EXCEL TOGETHER
- Options for Publishing from Excel
- Pin Excel Elements to Power BI
- Analyze in Excel (Power BI Pro or Premium)
- Excel Publish: Upload and Export to Power BI
- Sharing Published Excel Dashboards (Power BI Pro or Premium)
- Project Requirement Analysis
- Implementing SDLC Phases
- Requirement Gathering, FSA
PHASE 1:
- PBIX Report Design
- Visualizations, Properties
- Analytics and Formatting
PHASE 2:
- Data Modeling, Power Query
- Dynamic Connections, Azure DB
- Parameters and M Lang Scripts
PHASE 3:
- DAX Requirements, Analysis
- Cloud and Report Server
- Project FAQs and Solutions
About the Trainer
- 20+ Years of experience in Data Analytics and Data Science.
- Delivered 100+ projects to the industry
- Currently Involved in various international projects

